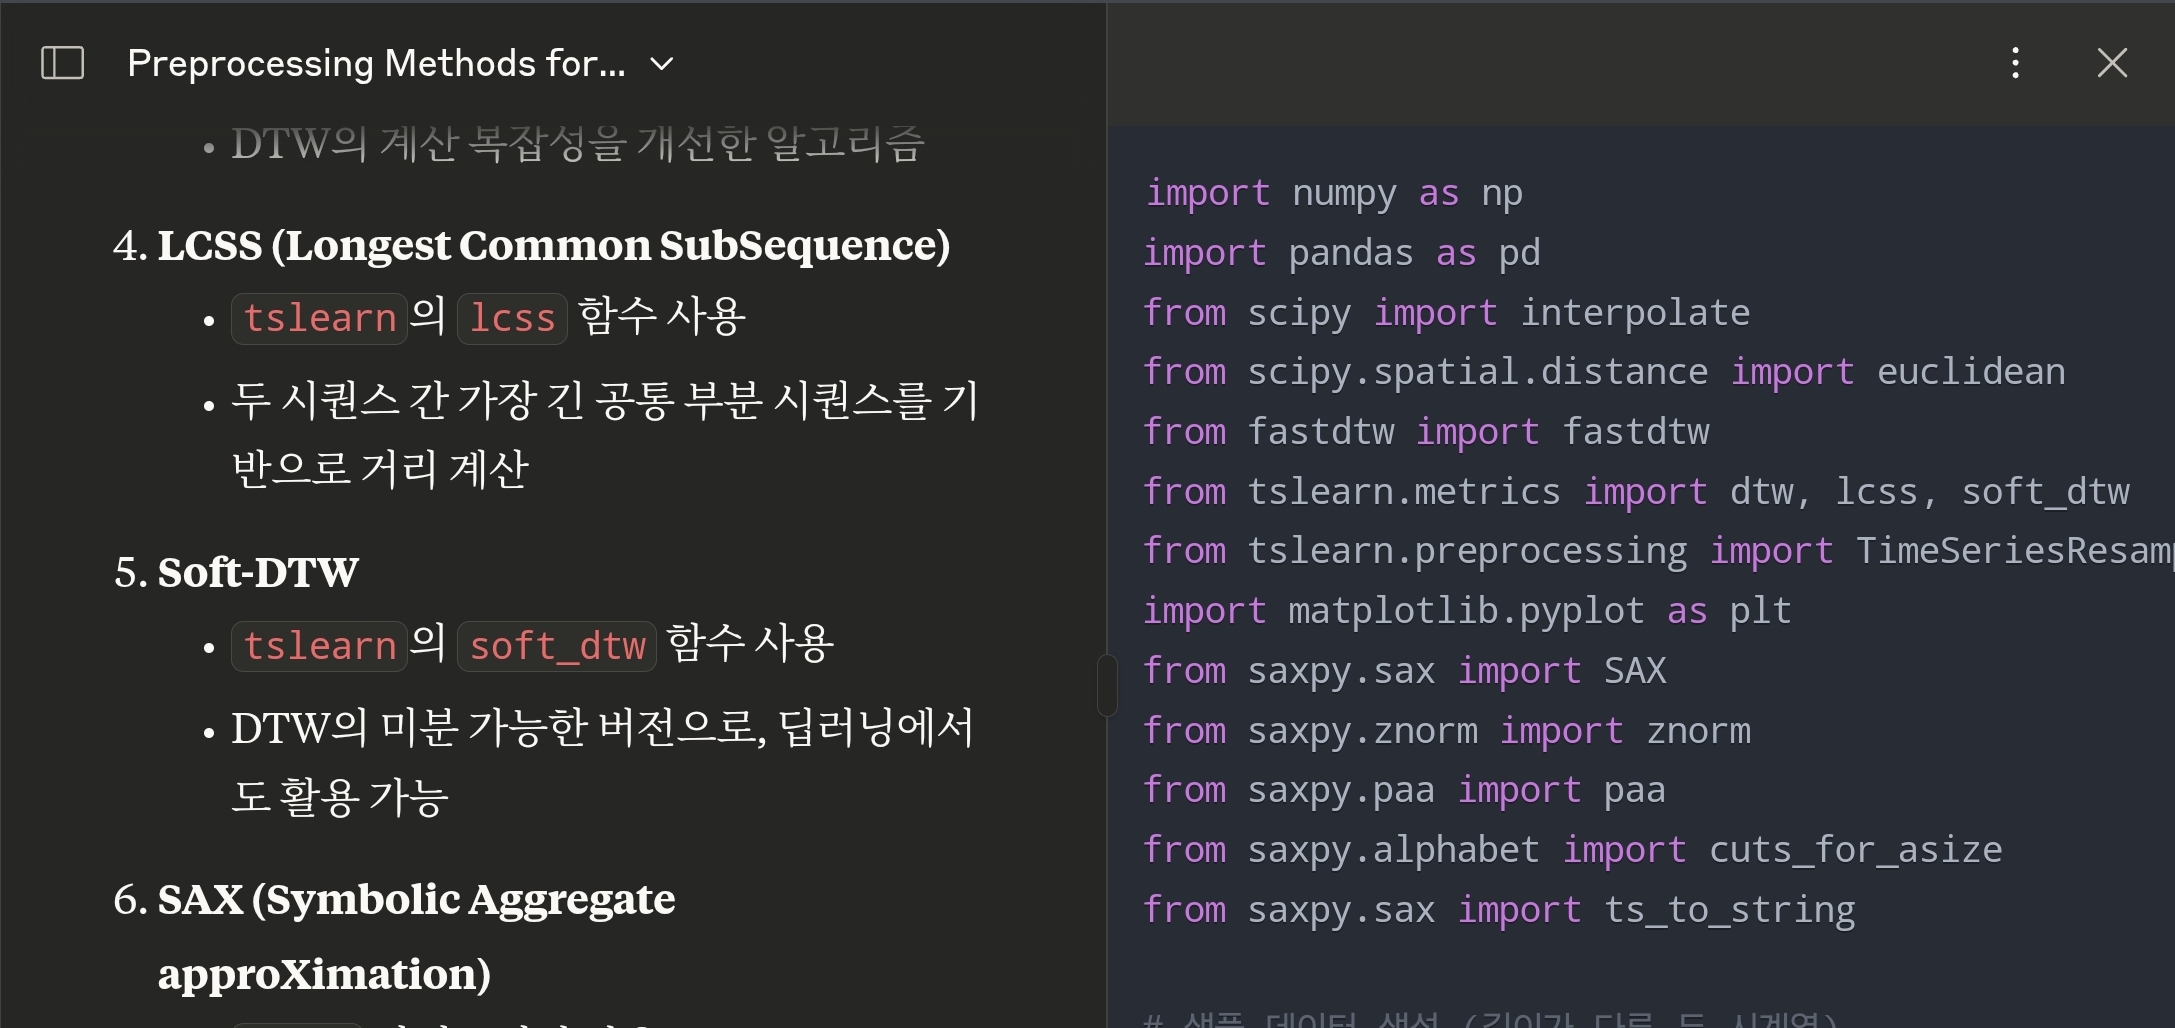
길이가 다른 시계열 데이터를 비교하는 다양한 방법들의 Python 예제 코드를 제공해 드리겠습니다.

위 코드는 길이가 다른 시계열 데이터를 비교하는 7가지 주요 방법의 예제를 포함하고 있습니다. 각 방법별 설명과 사용법은 다음과 같습니다:
1. **리샘플링 + 유클리드 거리**
- 두 시계열을 동일한 길이로 리샘플링한 후 유클리드 거리 계산
- `scipy.interpolate.interp1d`를 사용하여 선형 보간 수행
2. **DTW (Dynamic Time Warping)**
- `tslearn` 라이브러리의 `dtw` 함수 사용
- 길이가 다른 시계열 간 최적의 정렬 경로를 찾아 거리 계산
3. **FastDTW**
- `fastdtw` 라이브러리 사용
- DTW의 계산 복잡성을 개선한 알고리즘
4. **LCSS (Longest Common SubSequence)**
- `tslearn`의 `lcss` 함수 사용
- 두 시퀀스 간 가장 긴 공통 부분 시퀀스를 기반으로 거리 계산
5. **Soft-DTW**
- `tslearn`의 `soft_dtw` 함수 사용
- DTW의 미분 가능한 버전으로, 딥러닝에서도 활용 가능
6. **SAX (Symbolic Aggregate approXimation)**
- `saxpy` 라이브러리 사용
- 시계열을 심볼로 변환하여 비교
7. **시간 기반 리샘플링**
- `pandas`의 `resample` 함수 사용
- 시간 인덱스를 기반으로 일정한 주기로 데이터 집계
코드를 실행하기 위해 필요한 라이브러리는 다음과 같습니다:
```
pip install numpy pandas scipy fastdtw tslearn matplotlib saxpy
```
이 예제 코드를 실제 데이터에 적용할 때는 데이터의 특성과 분석 목적에 맞게 파라미터를 조정하는 것이 중요합니다. 또한, 여러 방법의 결과를 비교하여 가장 적합한 방법을 선택하시기 바랍니다.

import numpy as np
import pandas as pd
from scipy import interpolate
from scipy.spatial.distance import euclidean
from fastdtw import fastdtw
from tslearn.metrics import dtw, lcss, soft_dtw
from tslearn.preprocessing import TimeSeriesResampler
import matplotlib.pyplot as plt
from saxpy.sax import SAX
from saxpy.znorm import znorm
from saxpy.paa import paa
from saxpy.alphabet import cuts_for_asize
from saxpy.sax import ts_to_string
# 샘플 데이터 생성 (길이가 다른 두 시계열)
np.random.seed(42)
ts1 = np.sin(np.linspace(0, 10, 100)) + np.random.normal(0, 0.1, 100) # 길이 100
ts2 = np.sin(np.linspace(0, 15, 150)) + np.random.normal(0, 0.1, 150) # 길이 150
# 데이터 시각화
plt.figure(figsize=(12, 6))
plt.subplot(2, 1, 1)
plt.plot(np.linspace(0, 10, 100), ts1)
plt.title('Time Series 1 (Length 100)')
plt.subplot(2, 1, 2)
plt.plot(np.linspace(0, 15, 150), ts2, color='orange')
plt.title('Time Series 2 (Length 150)')
plt.tight_layout()
plt.savefig('original_timeseries.png')
plt.close()
# 방법 1: 리샘플링 (Resampling)
def resampling_example(ts1, ts2, target_length=120):
"""리샘플링을 사용한 방법"""
# 두 시계열을 동일한 길이로 리샘플링
x1 = np.linspace(0, 1, len(ts1))
x2 = np.linspace(0, 1, len(ts2))
# 선형 보간을 이용한 리샘플링
f1 = interpolate.interp1d(x1, ts1)
f2 = interpolate.interp1d(x2, ts2)
# 새로운 x 값에 대한 y 값 계산
x_new = np.linspace(0, 1, target_length)
ts1_resampled = f1(x_new)
ts2_resampled = f2(x_new)
# 결과 시각화
plt.figure(figsize=(12, 6))
plt.plot(x_new, ts1_resampled, label='TS1 Resampled')
plt.plot(x_new, ts2_resampled, label='TS2 Resampled')
plt.title(f'Time Series after Resampling (Length {target_length})')
plt.legend()
plt.savefig('resampling_result.png')
plt.close()
# 유클리드 거리 계산
distance = np.sqrt(np.sum((ts1_resampled - ts2_resampled) ** 2))
return {
'ts1_resampled': ts1_resampled,
'ts2_resampled': ts2_resampled,
'euclidean_distance': distance
}
# 방법 2: DTW (Dynamic Time Warping)
def dtw_example(ts1, ts2):
"""DTW를 사용한 방법"""
# 2D 배열로 변환 (tslearn 요구사항)
ts1_2d = ts1.reshape(-1, 1)
ts2_2d = ts2.reshape(-1, 1)
# DTW 거리 계산
distance = dtw(ts1_2d, ts2_2d)
# 결과 반환
return {
'dtw_distance': distance
}
# 방법 3: FastDTW
def fastdtw_example(ts1, ts2):
"""FastDTW를 사용한 방법"""
# FastDTW 적용
distance, path = fastdtw(ts1, ts2, dist=euclidean)
# 결과 반환
return {
'fastdtw_distance': distance,
'warp_path': path
}
# 방법 4: LCSS (Longest Common SubSequence)
def lcss_example(ts1, ts2):
"""LCSS를 사용한 방법"""
# 2D 배열로 변환
ts1_2d = ts1.reshape(-1, 1)
ts2_2d = ts2.reshape(-1, 1)
# LCSS 거리 계산 (epsilon은 유사성 임계값)
distance = lcss(ts1_2d, ts2_2d, epsilon=0.1)
# 결과 반환
return {
'lcss_distance': distance
}
# 방법 5: Soft-DTW
def soft_dtw_example(ts1, ts2):
"""Soft-DTW를 사용한 방법"""
# 2D 배열로 변환
ts1_2d = ts1.reshape(-1, 1)
ts2_2d = ts2.reshape(-1, 1)
# Soft-DTW 거리 계산 (gamma는 소프트닝 파라미터)
distance = soft_dtw(ts1_2d, ts2_2d, gamma=1.0)
# 결과 반환
return {
'soft_dtw_distance': distance
}
# 방법 6: SAX (Symbolic Aggregate approXimation)
def sax_example(ts1, ts2):
"""SAX를 사용한 방법"""
# SAX 객체 초기화 (단어 길이 = 10, 알파벳 크기 = 5)
sax = SAX(wordSize=10, alphabetSize=5)
# 데이터 정규화 및 PAA 변환
ts1_znorm = znorm(ts1)
ts2_znorm = znorm(ts2)
# 동일한 길이로 PAA 변환
ts1_paa = paa(ts1_znorm, 10)
ts2_paa = paa(ts2_znorm, 10)
# 알파벳 컷 포인트 계산
alphabet_cuts = cuts_for_asize(5)
# SAX 변환
ts1_sax = ts_to_string(ts1_paa, cuts=alphabet_cuts)
ts2_sax = ts_to_string(ts2_paa, cuts=alphabet_cuts)
# 결과 반환
return {
'ts1_sax': ts1_sax,
'ts2_sax': ts2_sax,
'min_dist': sax.compare_strings(ts1_sax, ts2_sax)
}
# 방법 7: 시간 기반 리샘플링 (Time-based Resampling)
def time_based_resampling_example():
"""시간 기반 리샘플링을 사용한 방법"""
# 시간 인덱스가 있는 DataFrame 생성
date_range1 = pd.date_range('2023-01-01', periods=100, freq='D')
date_range2 = pd.date_range('2023-01-01', periods=150, freq='12H')
df1 = pd.DataFrame({
'value': ts1
}, index=date_range1)
df2 = pd.DataFrame({
'value': ts2
}, index=date_range2)
# 주별 데이터로 리샘플링
df1_weekly = df1.resample('W').mean()
df2_weekly = df2.resample('W').mean()
# 결과 시각화
plt.figure(figsize=(12, 6))
plt.plot(df1_weekly.index, df1_weekly['value'], label='TS1 Weekly')
plt.plot(df2_weekly.index, df2_weekly['value'], label='TS2 Weekly')
plt.title('Time Series after Weekly Resampling')
plt.legend()
plt.savefig('time_based_resampling.png')
plt.close()
# 공통 기간에 대한 유클리드 거리 계산
common_index = df1_weekly.index.intersection(df2_weekly.index)
distance = np.sqrt(np.sum((df1_weekly.loc[common_index, 'value'].values -
df2_weekly.loc[common_index, 'value'].values) ** 2))
return {
'df1_weekly': df1_weekly,
'df2_weekly': df2_weekly,
'euclidean_distance': distance
}
# 모든 방법 실행 및 결과 출력
if __name__ == "__main__":
print("\n===== 1. 리샘플링 + 유클리드 거리 =====")
resampling_result = resampling_example(ts1, ts2)
print(f"리샘플링 후 유클리드 거리: {resampling_result['euclidean_distance']:.4f}")
print("\n===== 2. DTW (Dynamic Time Warping) =====")
dtw_result = dtw_example(ts1, ts2)
print(f"DTW 거리: {dtw_result['dtw_distance']:.4f}")
print("\n===== 3. FastDTW =====")
fastdtw_result = fastdtw_example(ts1, ts2)
print(f"FastDTW 거리: {fastdtw_result['fastdtw_distance']:.4f}")
print("\n===== 4. LCSS (Longest Common SubSequence) =====")
lcss_result = lcss_example(ts1, ts2)
print(f"LCSS 거리: {lcss_result['lcss_distance']:.4f}")
print("\n===== 5. Soft-DTW =====")
soft_dtw_result = soft_dtw_example(ts1, ts2)
print(f"Soft-DTW 거리: {soft_dtw_result['soft_dtw_distance']:.4f}")
print("\n===== 6. SAX (Symbolic Aggregate approXimation) =====")
sax_result = sax_example(ts1, ts2)
print(f"SAX 변환 (TS1): {sax_result['ts1_sax']}")
print(f"SAX 변환 (TS2): {sax_result['ts2_sax']}")
print(f"SAX 기반 최소 거리: {sax_result['min_dist']:.4f}")
print("\n===== 7. 시간 기반 리샘플링 =====")
time_result = time_based_resampling_example()
print(f"시간 기반 리샘플링 후 유클리드 거리: {time_result['euclidean_distance']:.4f}")
'코딩연습' 카테고리의 다른 글
| 클로드 AI 100% 활용하는 프롬프트 엔지니어링 완벽 가이드 (1) | 2025.07.14 |
|---|---|
| 심심해서 해봤어. Vibe coding (0) | 2025.05.24 |
| 길이가 다른 시계열 데이터를 비교 (0) | 2025.04.01 |
| 파이썬 figure에서 zoom in/out 가능한 방법은? (0) | 2025.01.06 |
| 자기지도학습(SSL)의 모든 것: 레이블 없는 데이터로 AI 학습하기 (1) | 2024.11.22 |
